


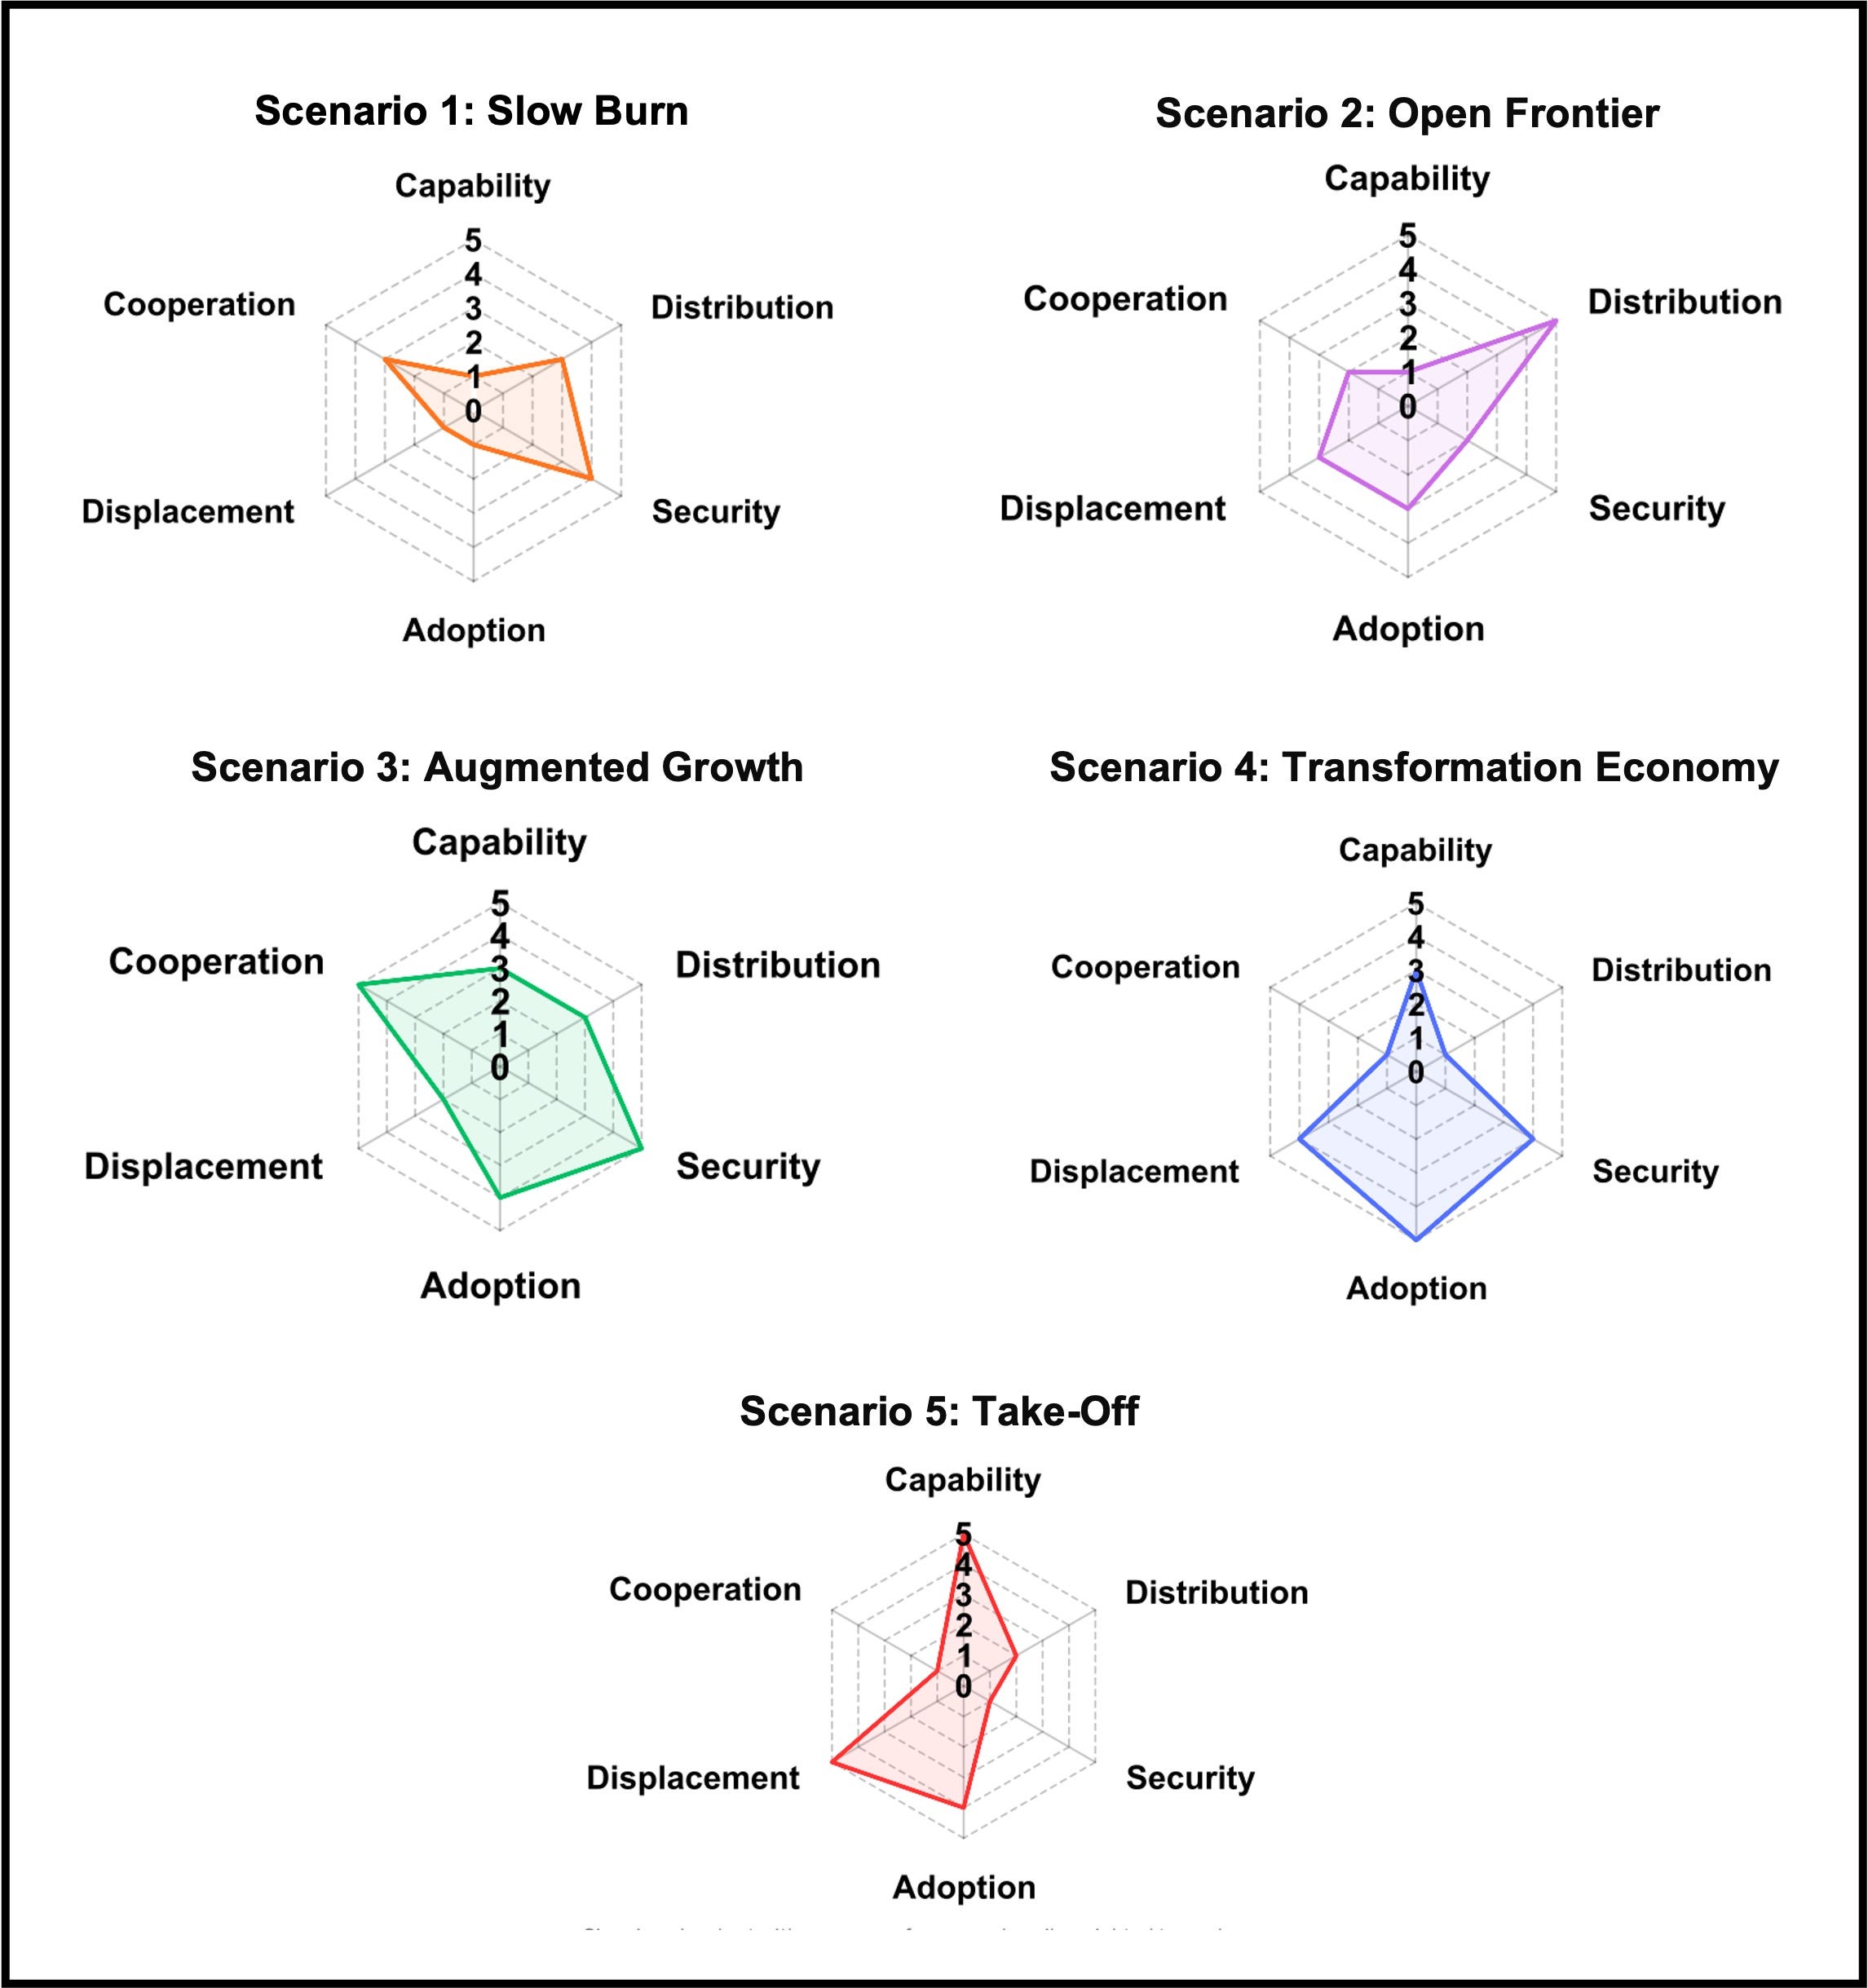
Today we launch Cassi’s Forecast Room (on our newly redesigned website), with our first project tracking the likelihood of the UK’s AI Scenarios: five AI scenarios from 1, Slow Burn, to 5, Fast Take Off. See radar charts from the original report:
In the last post, I acknowledged that going on and on about how we are underestimating the pace and profundity of AI progress, the risk, threat and opportunity it presents to the UK, can make one sound like a maniac – one exhibiting, to take one of the OED’s definitions ‘excessive enthusiasm or passion’, before arguing that in looking at AI progress and its likely effects, you can’t be measured – reporting on the likely outcomes based on the available evidence, and still sound measured. Face the facts, and risking being seen as a single-issue maniac is the only way to maintain your analytical integrity: telling people what you judge they need to know, rather than what they want to hear.
This is as distinct from being a fanatic, which as Churchill put it is one who ‘won’t change his mind, and won’t change the subject’ (although I acknowledged this might be how you are perceived). The reason for this is, speaking personally, but knowing the same is true for many others paying close attention to AI progress, I would change my mind, if the evidence changed1. Strong opinions, lightly held.
For example - if we start to see a levelling off in capabilities from current architectures and approaches (benchmarks progress reducing or stalling), evidence that increasing the amount of compute used to train models, or the volume of data we train them on are not increasing capabilities as fast, and/or a pronounced slow-down in the rate of improvement in the efficiency of algorithms, or evidence that new approaches to AI are not yielding further breakthroughs – then I would change my mind, and many others would too. I’d feel freed from pushing the need to respond with urgency and resources proportionate to the decreasing urgency and risk. But we are seeing the opposite to be the case – all these things are accelerating. The question is – what might change the Government’s mind, to drive a faster response?
The Forecast Room
To make the UK AI Scenarios more concrete - and hopefully to help drive a much more structured, rigorous conversation on AI progress - we extracted 101 claims, assumptions or implicit predictions from the UK Government’s AI Scenarios published in June, made them into forecastable, resolvable questions, and applied Cassi’s AI forecasting engine to probabilistically estimate their likelihood.
On the dashboard you can break them out into forecastable questions against the various elements described in the report:
(a) scenarios,
(b) trajectory and
(c) critical uncertainties.
We hope that the dashboard proves useful for those in Government and outside planning in response to and preparation for the ongoing AI revolution. The dashboard is live and updated weekly. We hope they serve not as an absolute guide to the future, but – by applying one of the world’s leading forecasting AI’s - as a starting point for officials, Departments and private sector analysts to come up with their own forecasts and plan accordingly.
Dashboard Guide
You can sort the dashboard by scenario to look at the indicators – forecastable questions derived directly from the assumptions in the original UK AI Scenarios document, those things that would be true if that scenario were to come to pass, to see how likely they are, and which have already happened.
You can search by trajectory, the capability paths as described in the Scenarios document - Slowed, Continued and Taken Off. This lets readers separate questions about the rate of technical progress from the wider economic and political consequences.
Finally, you can search by ‘critical uncertainty’. There are six of these:
capability;
distribution and model access;
security;
adoption;
labour displacement;
and global cooperation.
Each forms an axis on the radar chart for each scenario scored 1 to 5.
This score needs to be read carefully. It is not a good-to-bad scale. It describes the relative position of a scenario within the report’s plausible range for 2030. For example, high security and high labour displacement have opposite social implications. High capability would support scientific progress but also increase security and labour risks.
The score filter is useful still as it allows a reader to ask whether evidence is accumulating near the lower, middle or upper part of that uncertainty range.
Consequently, where a forecast has resolved as ‘true’ i.e. where the assumption of what would be true if the related scenario, trajectory of critical uncertainty score were to manifest, we can map this onto the Scenario radar chart. This allows a reader to see which of the various possible futures is emerging.
Readers can list forecasts by probability order, to judge this themselves.
Strikingly, right now ‘Fast Take-Off’ has the greater number of resolved forecasts, and would seem to be the most likely scenario. Plan accordingly.
and, rest assured reader - at least in person - am more than willing to change the subject!